Internal study conducted with BioStrap & BrainTap team members.
Conducted Online in 2021.
Title:
Effect of Audio-Visual Brain Entrainment on Stress, Mood and Quality of Sleep: a trial with BioStrap & BrainTap team members.
Authors:
Kevin Longoria1; Erin Miller2; Francisco Cidral2,3
- BioStrap LLC, Los Angeles, CA.
- Braintap Technologies, New Bern NC-USA.
- Experimental Neuroscience Laboratory (LaNEx), University of Southern Santa Catarina (UNISUL), Brazil.
Objective:
The study objective was to investigate the effects of the Audio-Visual Brain Entrainment (ABE) on Stress, Mood and Quality of Sleep of BioStrap & BrainTap team members.
Methods:
Sample size consisted of 32 volunteers who were not making use of analgesics, anti-inflammatories or sleep aids at least seven (7) days prior to, as well as during the study, and who had no hearing disabilities. Study was conducted over the course of 5 weeks. During weeks 1 and 2 (From May 5th to 18th): Baseline Evaluation Phase. Participants were asked NOT to undergo BWE sessions. During weeks 3, 4 and 5 (From May 19th to June 9th): Intervention phase. Participants were asked to undergo two (2) BrainTap sessions a day. Assessments consisted of (1) online questionnaires and (2) “Sleep
Tracking with the Biostrap device”. Online questionnaire consisted of five (5) parts: Part 1: Questions on the use of Braintap and overall health and wellness questions; Part 2: Pittsburgh Quality of Sleep Index: to access Quality of Sleep – as a counterpoint to BioStrap. Part 3: Perceived Stress Scale: to measure the perception of stress. Part 4: The Brief Resilience Scale: to assess the ability to bounce back or recover from stress. Part 5: Profile of Mood States: a widespread instrument which measures mood. The questionnaires were conducted on the following dates: On May 5th: Baseline Questionnaires; On May 19th: Beginning of Intervention Questionnaires; On June 9th: End of Study Questionnaires. (2) Sleep Tracking with the Biostrap device: The participants were asked to wear the BioStrap Band during the two phases of the study (Baseline and Intervention). ABE sessions were delivered with the BrainTap App and/or a BrainTap headset (New Bern – NC – USA) in 20 to 30-minute sessions twice (2x) a day during the intervention phase (from May 19th to June 9th). The sessions entailed background music, guided meditation, as well as audio or audiovisual brainwave entrainment through binaural beats, isochronic tones and, in the case of the use of the headset, photic stimulation. Results indicate that Audio-Visual Brain Entrainment (ABE):
- Significantly decreased Stress and increased Quality of Sleep, Perceived stress and Mood (as assessed through validated research questionnaires – Figures 1, 2 and 3) but did not affect Resilience (Brief Resilience Scale – Figure 2B);
- Significantly increased quality of sleep, mood, energy levels; decreased the feeling of being nervous and stressed, annoyed or irritable; and increased the feeling of being “on top of things” and productive (as assessed through self-reported 10-point Likert scale – Figure 4);
- In regards to the data assessed with the BioStrap Bands, although results were trending to on a positive direction, data were not statistically significant [resting heart rate, resting Heart rate variability (HRV), peripheral capillary oxygen saturation (SpO2), respiratory rate, arterial elasticity, peripheral elasticity, arterial age, sleep duration, seep efficiency(%), deep sleep (in minutes), light sleep (in minutes), total time Awake (in minutes), sleep
In relation to adherence to Braintapping during the intervention phase of study, “end of the study questionnaire” yielded the results (Figure 9):
- 52.4% of the participants consistently BrainTapped twice (2x) a day during intervention phase; 47.6% did not.
- 9.5% of the participants reported undergoing zero (0) BrainTap sessions a day; 33.3%, one session; and 57.1%, two sessions a day. No participants underwent three sessions a day.
- 19% of the participants generally used only the App; 81% generally the APP + Headset; and 4.8% of the participants did not generally BrainTap.
Conclusion:
Overall results indicate that ABE significantly decreased Stress, increased Quality of Sleep, Mood and energy levels. Actigraphy data collected with the BioStrap Bands, although not statistically significant, indicated improvement in all parameters analyzed. Limitations of this trial are (1) inconsistent participation during the intervention phase, the small sample size, and the fact that the study was not placebo-controlled. A randomized blinded placebo-controlled trial with a larger sample size study is awarded to confirm the effects of ABE.
Graphs
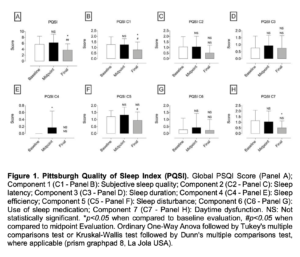
Figure 1. Pittsburgh Quality of Sleep Index (PQSI). Global PSQI Score (Panel A); Component 1 (C1 – Panel B): Subjective sleep quality; Component 2 (C2 – Panel C): Sleep latency; Component 3 (C3 – Panel D): Sleep duration; Component 4 (C4 – Panel E): Sleep efficiency; Component 5 (C5 – Panel F): Sleep disturbance; Component 6 (C6 – Panel G): Use of sleep medication; Component 7 (C7 – Panel H): Daytime dysfunction. NS: Not statistically significant. *p<0.05 when compared to baseline evaluation, #p<0.05 when compared to midpoint Evaluation. Ordinary One-Way Anova followed by Tukey’s multiple comparisons test or Kruskal-Wallis test followed by Dunn’s multiple comparisons test, where applicable (prism GraphPad 8, La Jola USA).
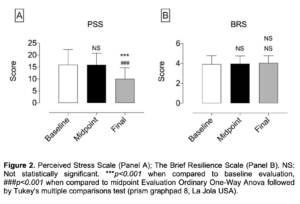
Figure 2. Perceived Stress Scale (Panel A); The Brief Resilience Scale (Panel B). NS: Not statistically significant. ***p<0.001 when compared to baseline evaluation, ###p<0.001 when compared to midpoint Evaluation Ordinary One-Way Anova followed by Tukey’s multiple comparisons test (prism graphpad 8, La Jola USA).
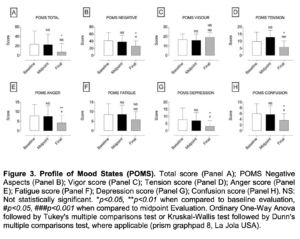
Figure 3. Profile of Mood States (POMS). Total score (Panel A); POMS Negative Aspects (Panel B); Vigor score (Panel C); Tension score (Panel D); Anger score (Panel E); Fatigue score (Panel F); Depression score (Panel G); Confusion score (Panel H). NS: Not statistically significant. *p<0.05, **p<0.01 when compared to baseline evaluation, #p<0.05, ###p<0.001 when compared to midpoint Evaluation. Ordinary One-Way Anova followed by Tukey’s multiple comparisons test or Kruskal-Wallis test followed by Dunn’s multiple comparisons test, where applicable (prism graphpad 8, La Jola USA).
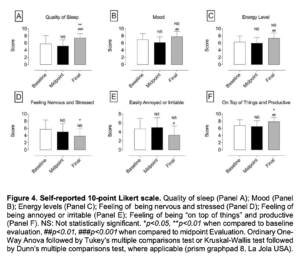
Figure 4. Self-reported 10-point Likert scale. Quality of sleep (Panel A); Mood (Panel B); Energy levels (Panel C); Feeling of being nervous and stressed (Panel D); Feeling of being annoyed or irritable (Panel E); Feeling of being “on top of things” and productive (Panel F). NS: Not statistically significant. *p<0.05, **p<0.01 when compared to baseline evaluation, ##p<0.01, ###p<0.001 when compared to midpoint Evaluation. Ordinary One- Way Anova followed by Tukey’s multiple comparisons test or Kruskal-Wallis test followed by Dunn’s multiple comparisons test, where applicable (prism graphpad 8, La Jola USA).
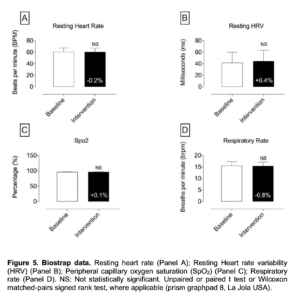
Figure 5. Biostrap data. Resting heart rate (Panel A); Resting Heart rate variability (HRV) (Panel B); Peripheral capillary oxygen saturation (SpO2) (Panel C); Respiratory rate (Panel D). NS: Not statistically significant. Unpaired or paired t test or Wilcoxon matched-pairs signed rank test, where applicable (prism graphpad 8, La Jola USA).
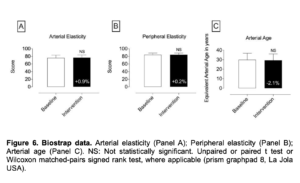
Figure 6. Biostrap data. Arterial elasticity (Panel A); Peripheral elasticity (Panel B); Arterial age (Panel C). NS: Not statistically significant. Unpaired or paired t test or Wilcoxon matched-pairs signed rank test, where applicable (prism graphpad 8, La Jola USA).
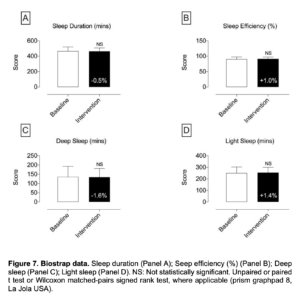
Figure 7. Biostrap data. Sleep duration (Panel A); Seep efficiency (%) (Panel B); Deep sleep (Panel C); Light sleep (Panel D). NS: Not statistically significant. Unpaired or paired t test or Wilcoxon matched-pairs signed rank test, where applicable (prism graphpad 8, La Jola USA).
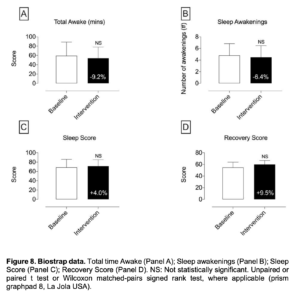
Figure 8. Biostrap data. Total time Awake (Panel A); Sleep awakenings (Panel B); Sleep Score (Panel C); Recovery Score (Panel D). NS: Not statistically significant. Unpaired or paired t test or Wilcoxon matched-pairs signed rank test, where applicable (prism graphpad 8, La Jola USA).
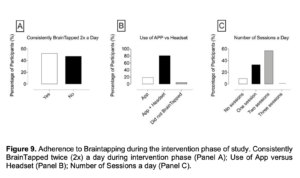
Figure 9. Adherence to Braintapping during the intervention phase of study. Consistently BrainTapped twice (2x) a day during intervention phase (Panel A); Use of App versus Headset (Panel B); Number of Sessions a day (Panel C).