Effect of Audio-Visual Brain Entrainment on Mood and Quality of Sleep: a pilot trial with university students
Presented at the 2020 International Congress on Integrative Medicine and Health. Published at Global Advances in Health and Medicine Volume 9, 2020. DOI: 10.1177/2164956120912849.
Title: Effect of Audio-Visual Brain Entrainment on Mood and Quality of Sleep: a pilot trial with university students.
Authors: Daniel Fernandes Martins1,2,3, Daiana Cristina Salm1,2,3, Luiz Augusto Belmonte1,2,3, Bruna Hoffmann de Oliveira1,2,3, Luana Meneghini Belmonte1,2,3, Francisco Jose Cidral-Filho1,2, Patrick K. Porter4
Affiliation:
1- Experimental Neuroscience Laboratory (LaNEx), University of Southern Santa Catarina, Palhoça, Santa Catarina, Brazil.
2- Postgraduate Program in Health Sciences, University of Southern Santa Catarina, Santa Catarina, Brazil.
3- Graduate Program in Physiotherapy, University of Southern Santa Catarina, Santa Catarina, Brazil.
4- Quantum University, Honolulu, HI – USA.
Background: Brainwave entrainment occurs if a population of neurons adopts the phase of an entraining stimulus, i.e., rhythmic visual or auditory (Isochronic tones, Binaural beats) stimulation that elicits synchronization of neural oscillations.
Objective: The Study objective was to investigate the effect of the Audio-Visual Brain Entrainment(ABE) on Mood and Quality of Sleep of university students.
Methods: The study was conducted at the Laboratory of Experimental Neuroscience – University of Southern Santa Catarina (UNISUL), Brazil, and the protocol was approved by the Institutions Ethics committee. Informed consent forms were obtained during patient screening phase of the study at the site of the tests. Sample size consisted of 7 university students (Four males and three females. Ages between 20 and 58), who were not making use of analgesics, anti-inflammatories or sleep aids 7 (seven) days prior to, as well as during the study, and who had no hearing disabilities. ABE was delivered with a BrainTap headset (New Bern – NC – USA) in 20-minute sessions 3 times a week for 6 weeks. Session consists of Binaural beats at 18 to 0.5 HZ, Isochronic Tones at 18 to .0.5 HZ and visual Entrainment through light-emitting diode lights at 470 nanometers (nm) flickering at 18 to 0.5 HZ. The following questionnaires were applied at baseline and after 6 weeks: Epworth Sleepness Scale – Daytime sleepiness (ESS), Insomnia Severity Index (ISI), Pittsburgh Quality of Sleep Index (PQSI), Depression Anxiety and Stress Scale (DASS-21), and Perceived Stress Scale (EPS-10).
Results: ABE effectively reduced ISI (data not statistically significant); PQSI (p<0.05); DASS-21 (data not statistically significant); and EPS-10 (data not statistically significant). The participants reported feeling very relaxed during the sessions.
Conclusion: Despite the reduced sample size (n=7), results indicate that Audio-Visual Brain Entrainment (ABE) significantly increased Quality of Sleep of university students (PQSI p<0.05). A lager sample size study is necessary to confirm and extend the effects of ABE on Mood.
Graphs
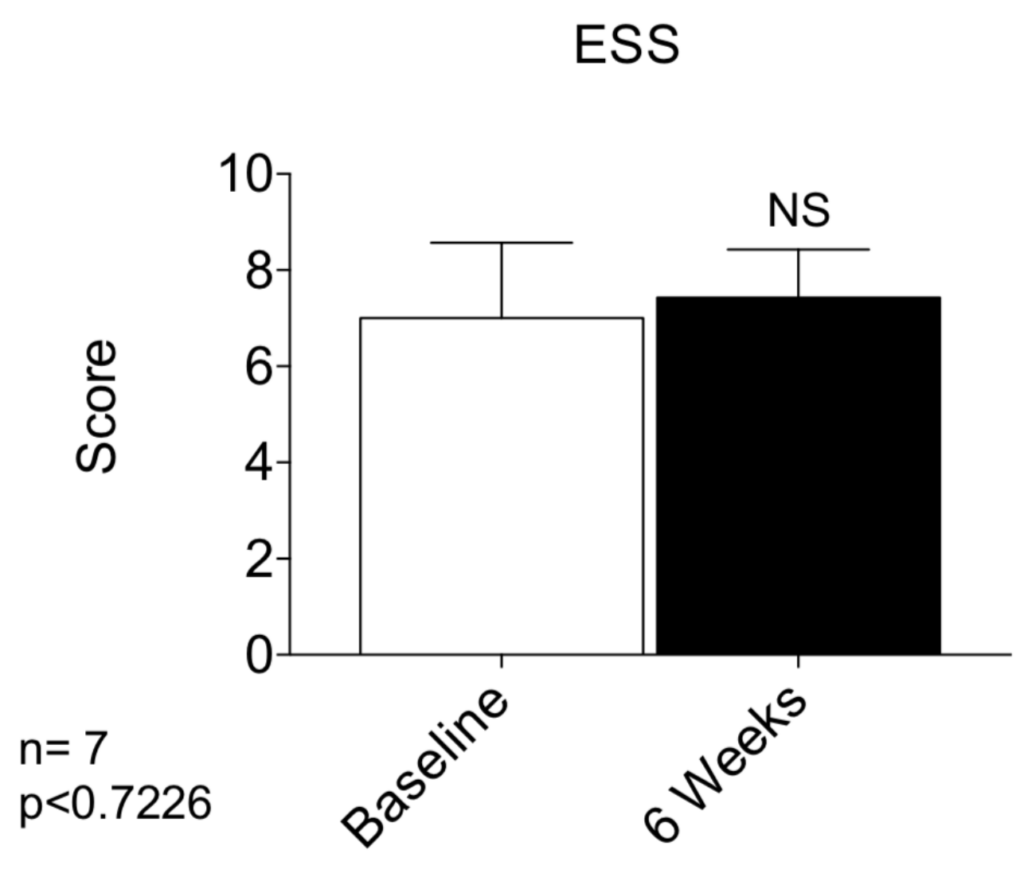
Epworth Sleepness Scale – Daytime sleepiness. The score is interpreted as follows:> 10 points = individuals with a high possibility of mild somnolence, while> 16 points are indicative of severe somnolence. The low scores are indicative of patients with low propensity to sleep and relax. NS: Not statistically significant. Paired t-test (prism graphpad 7, USA).
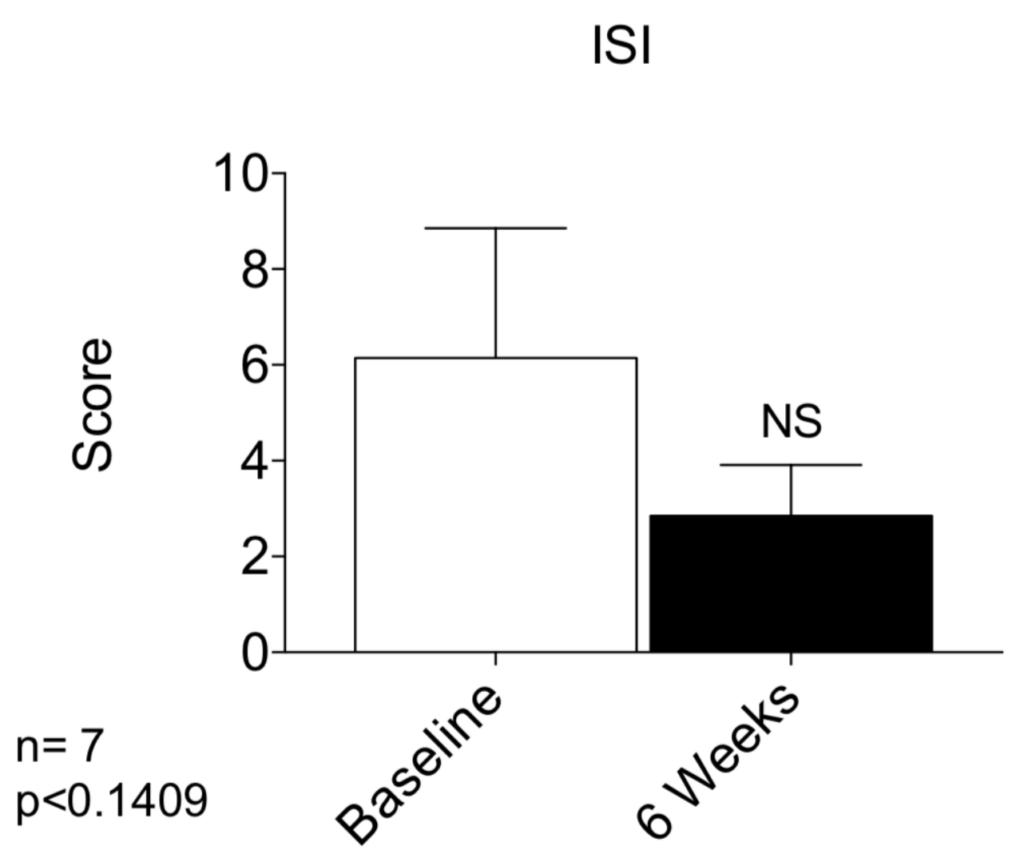
Insomnia Severity Index. Classification is as follows: (0-7) absence of insomnia; (8-14) lower limit for insomnia; (15-21) moderate clinical insomnia; (22-28) severe clinical insomnia. NS: Not statistically significant. Paired t-test (prism graphpad 7, USA).
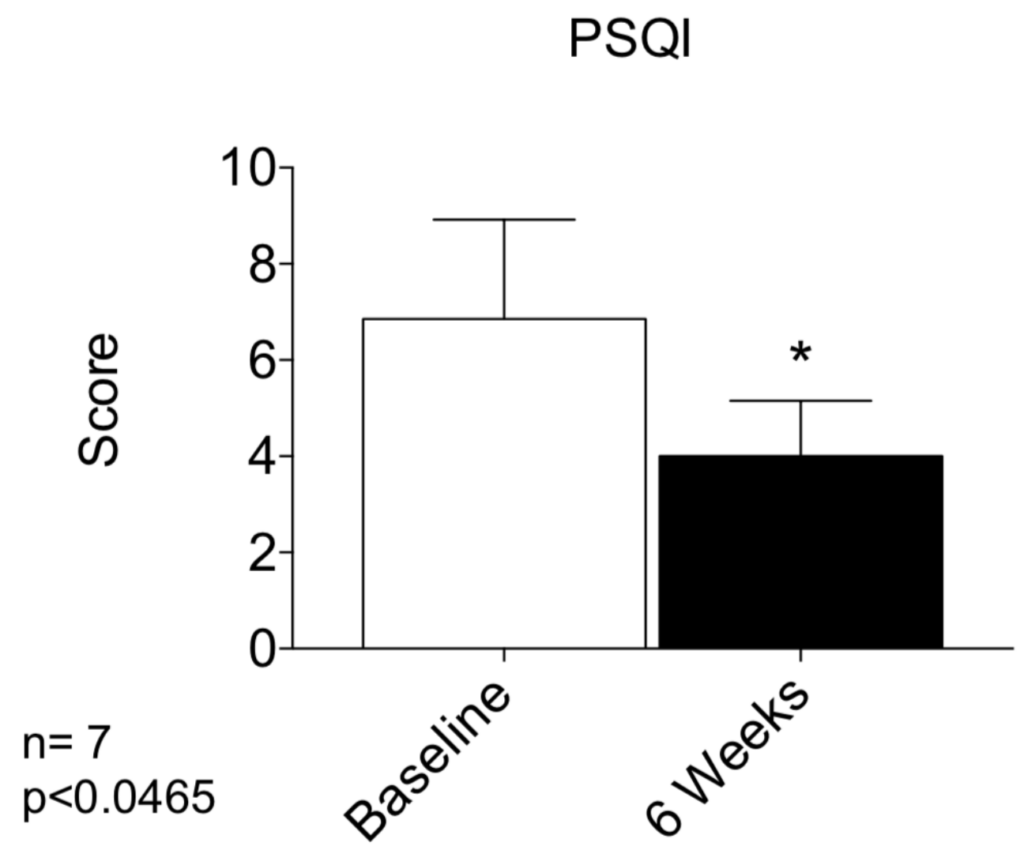
Pittsburgh Quality of Sleep Index. Seven components (from 0 to 21 items) are evaluated, which will generate a final score. The classification is according to the score: (0-4 points) good quality of sleep; (5 to 10 points) poor quality of sleep and (> 10 points) presence of sleep disorder. *p<0.05 when compared to baseline evaluation. Paired t-test (prism graphpad 7, USA).
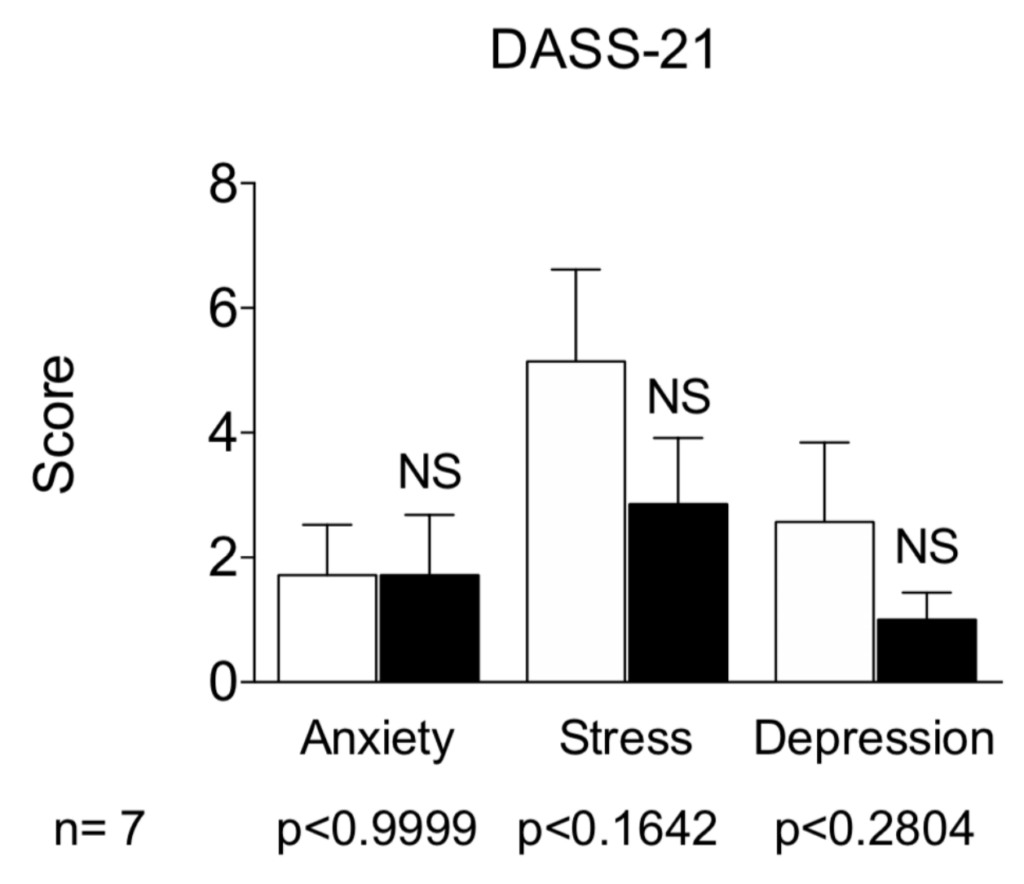
Depression Anxiety and Stress Scale. In this scale, 21 items are evaluated into 3 categories (anxiety, stress and depression) and for each category there are 7 associated items. The higher the score, the greater the impairment in the evaluated category. NS: Not statistically significant. Paired t-test (prism graphpad 7, USA).
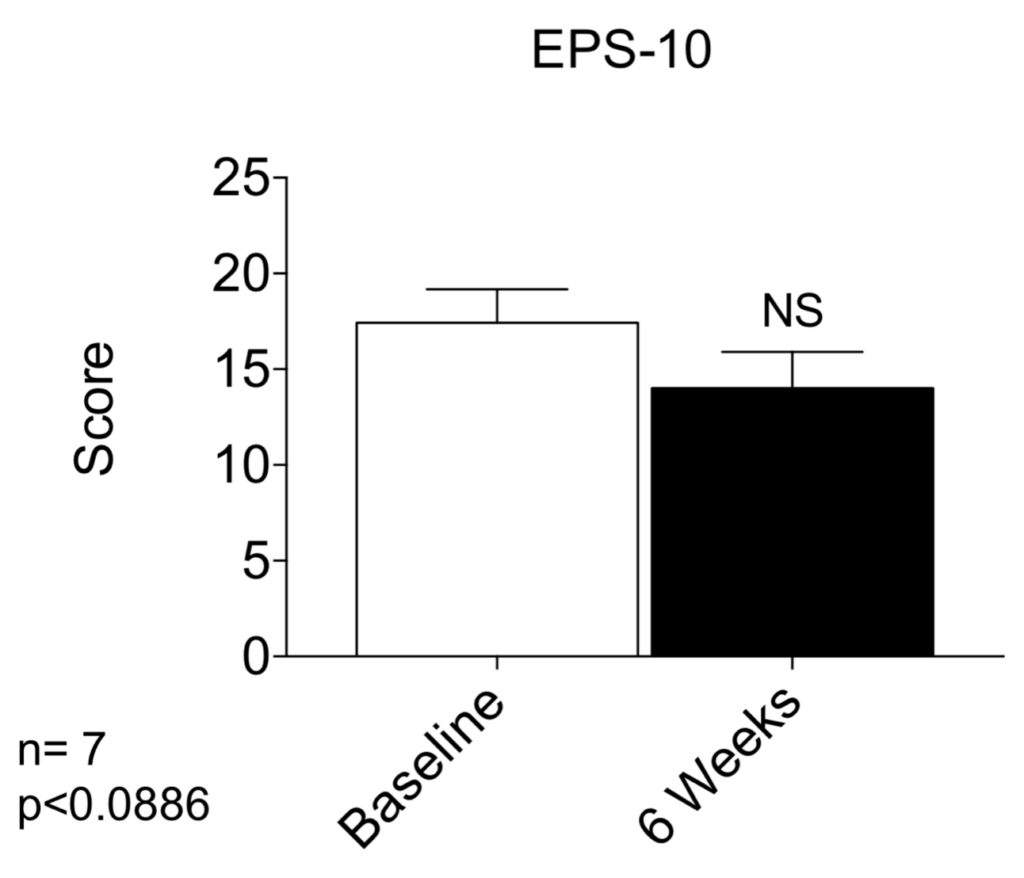
Perceived Stress Scale. The higher the score the higher the stress. NS: Not statistically significant. Paired t-test (prism graphpad 7, USA).